If your content portfolio were a stock portfolio, only a handful of “tickers” would carry the returns. The Pareto pattern shows up in nearly every site: a small slice of pages creates the vast majority of pipeline, transactions, and assisted conversions. This article gives you a business-first framework to identify those winners, understand why they win, and decide what to do next—without wading into tool setup or technical implementation.
Why the 80/20 lens belongs in your content strategy
- Focus beats breadth. Doubling down on proven revenue drivers yields faster ROI than spreading effort across dozens of low-impact posts.
- Signals compound. High-performing pages attract links, rank more broadly, and create internal-link leverage for the rest of the site.
- Defensibility. When budgets tighten, the pages that pay the bills justify their protection—and their expansion.
The point isn’t to starve the long tail; it’s to treat it like R&D while your top 20% fund the roadmap.
Define “revenue-driving” with CFO-friendly metrics
To compare pages fairly, evaluate them on outcomes—not vanity stats. Use a consistent scorecard (directional, not prescriptive):
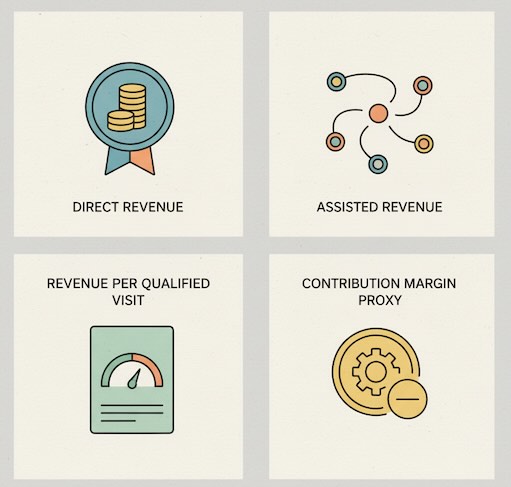
- Direct Revenue Contribution (DRC): Orders or deals attributed to a page in the same session or within a sensible attribution window.
- Assisted Revenue Value (ARV): Downstream revenue in which the page appears on the path (multi-touch).
- Revenue per Qualified Visit (RPQV): Revenue / visits that met a quality threshold (e.g., engaged depth or time). This normalizes for traffic size.
- Contribution Margin Proxy (CMP): Revenue × average gross margin for that product/offer—so you don’t crown pages that sell low-margin SKUs.
- Incremental Lift Potential (ILP): A strategic rating (Low/Med/High) that reflects how much upside remains via better positioning, internal links, richer assets, or pricing clarity.
Your goal: rank pages by a blend of magnitude (DRC + ARV) and efficiency (RPQV + CMP), then overlay potential (ILP). The pages that rank high on all three are your 20%.
Classify winners by the job they do
Not all top pages win for the same reason. Group them by role so you know how to amplify their strengths.
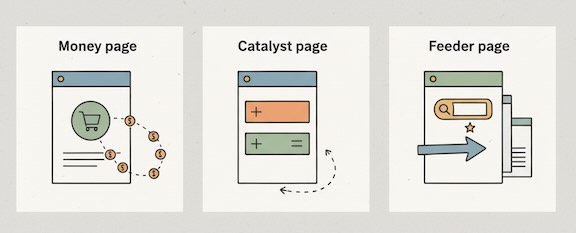
- Money Pages (Closer): Product pages, pricing, “get a quote,” high-intent comparison posts. They convert or start orders.
Signals: High DRC, strong RPQV, lower bounce among high-intent cohorts.
What to do next: Improve clarity (benefits, proof, objections), reduce choice friction, add confident “why us” proof where it matters most. - Catalyst Pages (Accelerator): Deep comparison guides, ROI explainers, implementation overviews. They shorten time-to-decision.
Signals: High ARV, noticeable lift in conversion rate for users who touched them, strong internal-link throughput.
What to do next: Add complementary assets (calculators, downloadable one-pagers), tighten calls-to-action aligned to stage (demo vs. sample vs. quiz). - Feeder Pages (Attractor): Topics that reliably bring qualified organic or partner traffic and hand off intent to Money/Catalyst pages.
Signals: Steady entrances from search, high internal click-through to key journeys, durable rankings.
What to do next: Strengthen above-the-fold handoffs, prune outdated sections, and expand into adjacent keywords tied to the same commercial theme.
This simple taxonomy keeps you from “optimizing everything the same way.” You protect closers, expand accelerators, and programmatically replicate attractors.
Patterns that usually separate the top 20% from the rest
Across ecommerce and B2B, the hit pages tend to share these traits:
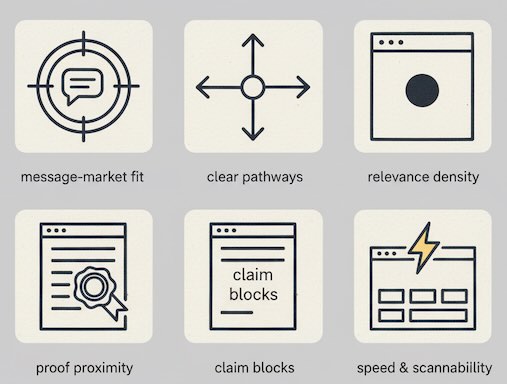
- High message–market fit. They speak to a specific pain with precise language (features → outcomes).
- Clear pathways. Prominent, relevant next steps (not generic CTAs) with contextual proof nearby.
- Strong relevance density. The page stays on one job; it doesn’t wander across multiple intents.
- Proof proximity. Testimonials, data, or mini-case snippets within one scroll of key claims.
- Load and layout discipline. Fast, scannable, and skimmable—so more readers reach the decisive sections.
If a page is close on these but not quite there, it often sits just outside the 20%—and becomes low-hanging fruit for rapid lift.
A pragmatic analysis flow (strategy, not setup)
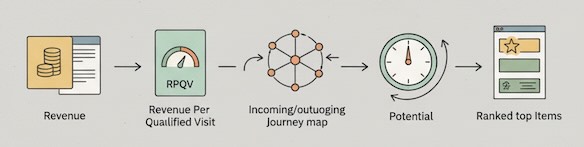
- Start with revenue, not traffic. Sort pages by DRC + ARV for the last 90–180 days. Note the top 20% threshold.
- Normalize for visit quality. Compare RPQV to spot “quiet killers” (lower traffic, outsized value per visit).
- Pull the journey view. For each candidate, list the most common incoming sources and outgoing clicks. You’re looking for natural handoff patterns.
- Assess potential. Assign ILP by asking: If we doubled qualified visits or improved conversion micro-steps, how much money is on the table?
- Prioritize by blended score. Ties go to pages with higher CMP and clearer line-of-sight to pipeline.
No need to debate attribution perfection. You’re ranking directionally to focus resources where they will most likely pay off.
What to do with the winners (and the almost-winners)
For the confirmed 20%: Protect and multiply.
- Defense: Monitor rankings and competitive encroachment, keep facts/pricing current, guard page speed and UX.
- Multiplication: Expand variants (regional, segment-specific), spin out tightly related topics, and strengthen the internal-link web pointing into and out of these pages.
For the next 20–30%: Tune and test the few levers that matter.
- Tighten headlines and intros to match searcher intent more precisely.
- Surface the most persuasive proof near primary CTAs.
- Clarify paths: one main action, one secondary action (not five).
- Consolidate redundant content that cannibalizes the same query or use case.
For the long tail: Treat as experiments.
- Keep only pieces that reliably assist or feed demand.
- Reposition or retire content that draws unqualified attention or creates maintenance overhead without a measurable assist.
Executive-friendly ways to report the 80/20 reality
Leadership needs clear, comparative economics:
- Revenue Concentration Curve: cumulative share of revenue by page rank (shows the Pareto cliff).
- Unit Economics Table: RPQV, CMP, and ARV side-by-side for the top and middle cohorts.
- Upside Model: conservative forecast of incremental revenue if top pages gain +20% qualified traffic or +20% micro-conversion rate.
- Risk Watchlist: top-page dependencies (single keyword, single partner, thin proof) that threaten revenue concentration.
This narrative reframes content from “output” to revenue infrastructure—and secures buy-in for continued investment.
Common traps to avoid
- Traffic bias: Crowning pages with the most visits, not the best economics.
- Attribution absolutism: Waiting for perfect multi-touch truth before acting. Directional patterns are enough to focus.
- Winner neglect: Letting your cash-cow pages decay while you chase new topics.
- One-size fixes: Applying the same optimization checklist to closers, accelerators, and attractors.
The takeaway
The 80/20 rule isn’t a slogan—it’s an operating system. Identify the pages that already carry your revenue, understand the job each one performs, and invest disproportionately where marginal effort compounds into outsized financial impact. Do that, and your content program stops being a cost center with occasional hits and starts behaving like a portfolio engineered for durable returns.