You don’t need an enterprise stack to run your blog like a pro. A handful of clear, behavior-driven metrics will tell you which ideas resonate, which channels actually bring readers, and which posts strengthen your personal brand. Here’s a focused, no-nonsense framework.
Start with the job your blog does
Pick one primary outcome for the next quarter. Examples:
- Grow audience: email subscribers, followers, RSS.
- Build authority: mentions, backlinks, invites to speak/guest post.
- Generate leads: contact form starts, discovery calls.
- Monetize content: affiliate clicks, product waitlist, course sign-ups.
Everything below ladders to that choice. If a metric doesn’t help a decision you’ll make in the next 30 days, drop it.
Acquisition: where readers come from
Why it matters: You’ll double down on the channels that deliver engaged readers (not just fly-by traffic).
Track
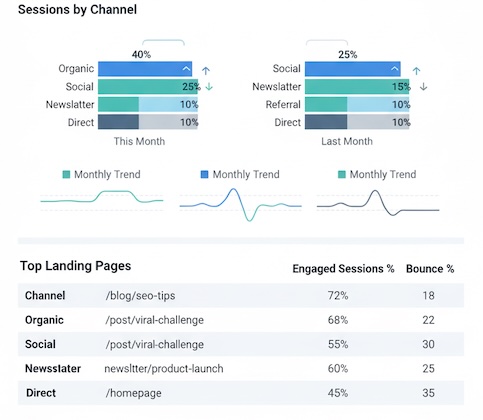
- Sessions & users by channel (Organic, Social, Newsletter, Referral, Direct).
Look for mix shifts—e.g., Organic up, Social flat. - New vs. returning readers. Personal brands thrive on returners; aim to nudge that share up over time.
- Top landing pages and their bounce/engagement rate by channel.
Decisions
- Scale the channels with the best engaged sessions per 1000 impressions.
- Build more content in the formats that land most often as entrances.
Engagement: are people actually reading?
Why it matters: Time and depth signal real attention—table stakes for authority and lead flow.
Track
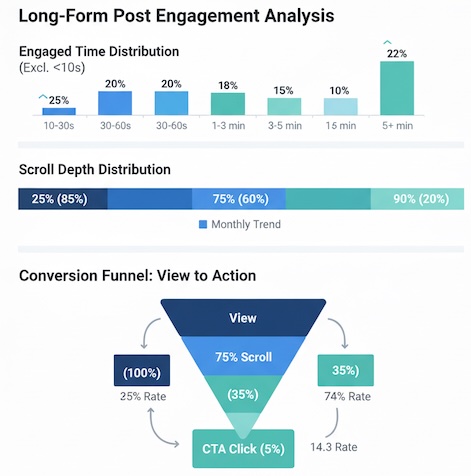
- Average engaged time on page (filter out <10-second sessions).
- Scroll depth distribution (25/50/75/90%).
- Click-through to next action: email CTAs, related posts, author bio links.
- Comment/save/share rate on posts that invite discussion.
Benchmarks (directional)
- 2–4 minutes engaged time for long-form (1,200–2,000 words).
- ≥50% of readers reaching 75% scroll on evergreen guides.
- 2–5% click-through to your primary CTA on top posts.
Decisions
- Move CTAs higher if most readers drop before 50%.
- Add a TL;DR or jump links if time is strong but scroll is weak.
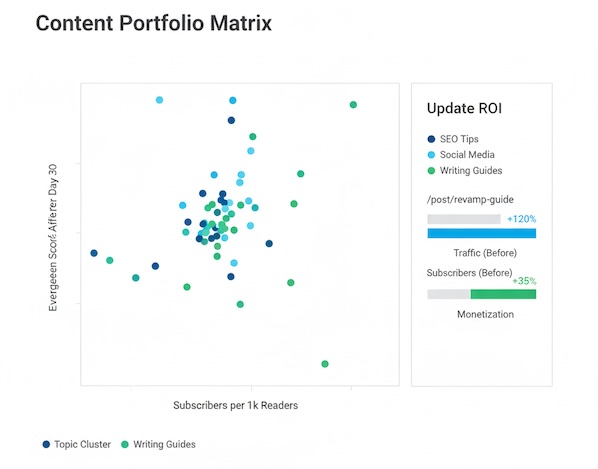
Content portfolio: keep, expand, retire
Why it matters: Your blog is a product line. Treat posts like SKUs.
Track
- Evergreen vs. spike posts. Plot traffic by week post-publish to see decay curves.
- Topic clusters. Group posts by theme; measure cluster-level sessions, subs, backlinks.
- Update ROI. Before/after lifts when you refresh a post (title, examples, year, internal links).
Decisions
- Expand clusters that produce both traffic and subscribers.
- Sunset or consolidate thin posts that never gain traction.
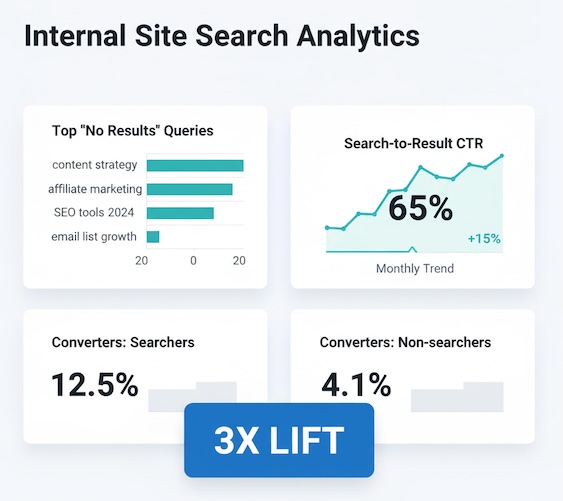
Internal discovery: what readers still can’t find
This is where blog search metrics pay off.
Track
- On-site search queries and “no results” terms (gold for new topics).
- Search-to-click rate on your internal results page.
- Searchers’ conversion rate vs. non-searchers (searchers often convert 2–3× better).
Decisions
- Create posts for high-intent queries you don’t cover.
- Add synonyms or tags to fix frequent internal site search no results patterns.
SEO early signals (lightweight)
You don’t need to chase every ranking report, but you do need leading indicators.
Track
- Impressions & CTR in search console for new posts at 7/14/28 days.
- Queries driving first impressions per post (are they the keywords you wrote for?).
- Backlinks gained (quality over count).
Decisions
- If CTR is low with decent position, test titles/meta.
- If impressions stall after four weeks, strengthen internal links from related posts.
Conversion: turn attention into assets
Why it matters: Audience you can re-reach is the compounding engine of a personal brand.
Track
- Email sign-ups by post (primary blog conversion).
- Lead magnet performance (download starts, completion, follow-up open/click).
- Contact form starts/completions (for consulting/coaching).
Decisions
- Give each top post a contextual CTA (relevant lead magnet beats generic by miles).
- Route high-intent readers to “Work with me” or FAQs; keep casual readers in the content loop.
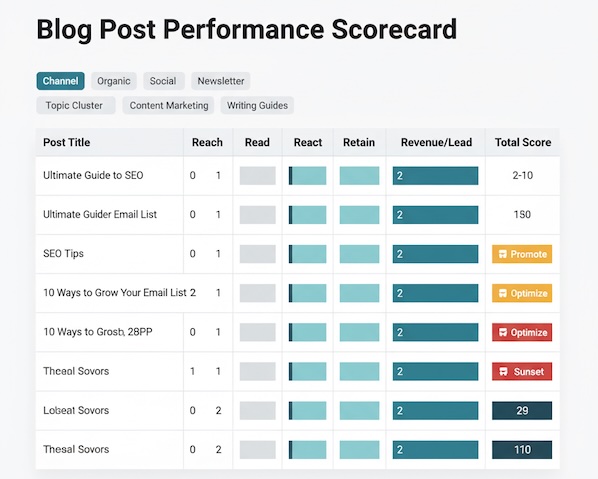
A simple score to measure the success of any blog post
Use this 5-point rubric to measure the success of any blog post without drowning in dashboards. Score 0–2 on each axis:
- Reach: Top, middle, or bottom third for 30-day unique readers.
- Read: ≥50% reach 75% depth and ≥2:30 engaged time?
- React: Comments + saves + shares per 100 readers.
- Retain: Email sign-ups per 100 readers.
- Revenue/Lead: Affiliate click-outs or qualified inquiries per 100 readers.
8–10 = Promote and clone the pattern. 5–7 = Optimize title/intro/CTA. 0–4 = Reposition, consolidate, or retire.
Cadence: lightweight blog monitoring
Consistency beats volume. Adopt a simple blog monitoring rhythm:
- Weekly (30–45 min):
- New post early signals (impressions, engagement, subs).
- Top entry pages last 7 days; fix any high-bounce mismatches.
- Monthly (60–90 min):
- Topic cluster review and update backlog.
- Channel mix and subscriber growth vs. last month.
- One A/B test result (title image, intro hook, CTA placement).
- Quarterly (2 hours):
- Portfolio audit: keep/expand/merge/retire.
- Goal reset and editorial plan for the next quarter.
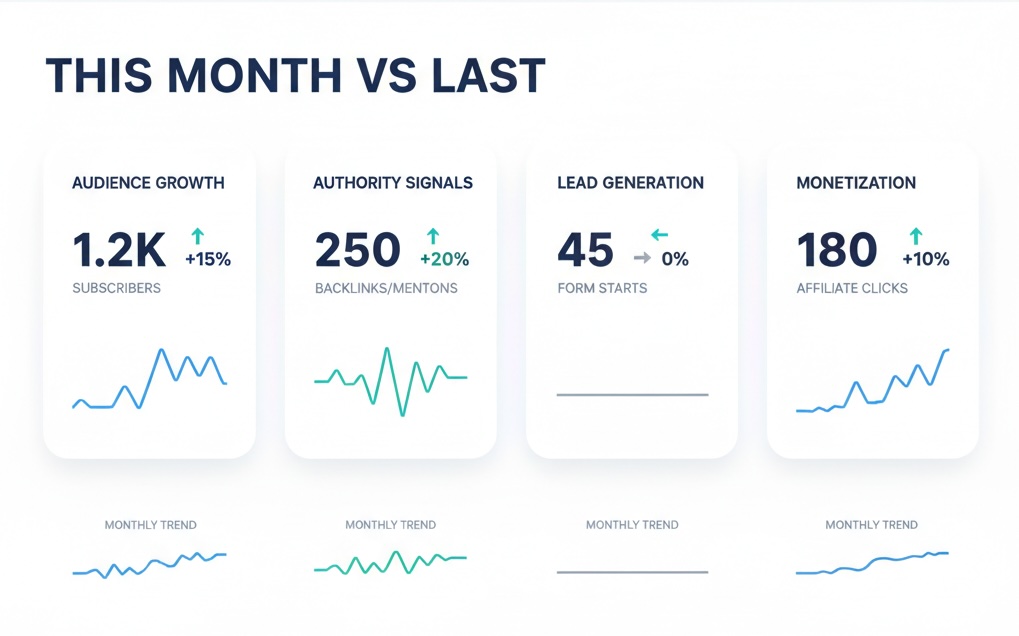
A starter dashboard (one screen)
- Acquisition tiles: Sessions by channel; new vs. returning; top 5 landing pages.
- Engagement tiles: Median engaged time; 75% scroll rate; next-action CTR.
- Conversion tiles: Email sign-ups by post; contact form starts; affiliate click-outs.
- Search tiles: Impressions/CTR trends; top queries; on-site search “no results.”
- Portfolio view: Posts by 30-day score (color-coded).
If you can’t see it on one screen, you’re tracking too much.
Common pitfalls (and how to dodge them)
- Chasing vanity traffic. Viral social spikes that never return don’t build a brand. Favor channels with high returning reader share.
- Over-indexing on averages. Segment by channel and post type; a “good” bounce rate for a glossary page differs from a deep guide.
- Title optimization at the expense of trust. Punchy is great; clickbait erodes authority and email list quality.
- Ignoring page experience. Slow pages tank mobile engagement; even a 0.5s delay can cut scroll depth.
- No post-publish plan. The first 7–10 days are leverage: repurpose snippets, cross-link from older posts, send to your list.
Turning insights into action (fast wins)
- Upgrade winners: Add a tailored lead magnet to your top 5 evergreen posts.
- Fix friction: Raise CTAs above the fold on posts where most readers drop at 40–60%.
- Fill gaps: Ship one post per month sourced from internal “no results” searches.
- Cluster power: Link new posts into an existing high-performing topic hub to accelerate impressions and dwell time.
Bottom line
Personal blog analytics isn’t about perfect dashboards—it’s about faster, smarter editorial decisions. Track acquisition you can influence, engagement that proves attention, and conversions that compound your brand. Keep it on one screen, review it on a schedule, and let the data nudge your next post, not dictate your voice.