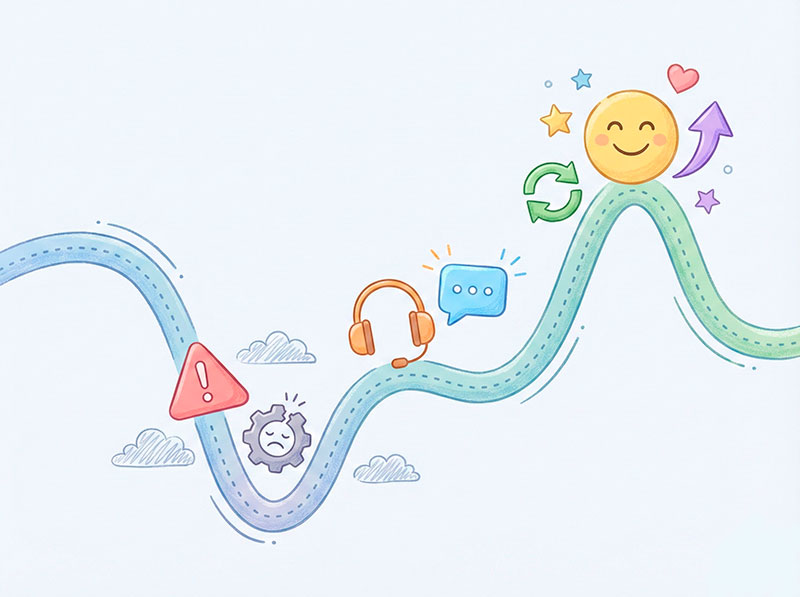
If you ask a product or marketing team what metric they want to improve, you’ll often hear the same answer: “We want better retention.”
But if you ask a follow-up question—“Cool, which exact user action do you want to see more often?”—the room gets quiet.
People talk about DAU, MAU, churn, and loyalty. Yet very few teams have picked one concrete action that separates a random user from a truly valuable, returning customer. That one action is your critical retention event.
Before we can define it, we need to talk about basics. Many teams still argue about what is customer retention, and they all secretly use slightly different definitions.
In this article, we’ll walk through:
- A simple, shared way to think about retention
- Why vague metrics like “logins” are not enough
- A step-by-step framework to pick your critical event
- Concrete examples across SaaS, e-commerce, marketplaces, and B2B
- How support and customer success fit into retention
- How to bake your critical event into tracking plans and dashboards
By the end, you’ll have a clear process your team can use this week.
Customer Retention in Plain English
Let’s strip away the jargon for a moment.
Retention is not a fancy metric for analysts. It’s just a way to answer a very basic question:
“Do people who tried us keep coming back to get value again?”
That’s it. Everything else—charts, formulas, dashboards—is a way to turn that simple idea into numbers.
If you want to go deeper into formulas and benchmarks, this guide to customer retention rate walks through how to calculate CRR and interpret it in practice.
A simple customer retention definition your team can agree on
Here’s a practical customer retention definition you can use:
Customer retention is the share of customers who keep coming back to use your product or service again within a given time period.
For example:
- In January, 100 people bought from your store.
- By March, 40 of those same people bought again.
If you look at “January customers retained by March”, your retention is 40%.
If you need a short definition customer retention sentence for internal docs, it could be:
“Retention is the percentage of customers who are still active after a certain amount of time.”
Sometimes teams use the word “customer”, sometimes “client”. In many B2B companies, the client retention meaning is almost the same thing—just on the level of an account or organization instead of a single person.
The exact wording isn’t as important as everyone using the same idea when they talk about retention.
Retention vs churn vs reactivation
To avoid confusion, let’s separate three simple states:
- Retained – a customer used your product in the past and is still using it within the time window you care about.
- Churned – a customer used your product before, then stopped using it and hasn’t come back within that window.
- Reactivated – a customer stopped for a while, then came back after being “inactive” for some time.
Here’s a tiny timeline example:
- Anna buys from your store in January.
- She doesn’t buy anything in February.
- She buys again in April.
If your “window” is “still active within two months”:
- Looking from January to March: Anna is churned.
- Looking from January to April: she is reactivated.
You can define similar windows for SaaS (active in the last 30 days), subscriptions (still paying by the end of the quarter), or B2B contracts (renewed for next year).
Up to this point, we’re still talking in business language: customers, time windows, and coming back. We still haven’t chosen which exact event in your analytics will represent that “coming back”.
That’s the next step.
From Generic Metrics to One Critical Retention Event
Many teams have dashboards full of “active users”, but almost no one agrees on what “active” actually means.
Sometimes “active” is:
- anyone who logged in
- anyone who opened the app
- anyone who visited any page
This looks good on a chart, but it doesn’t really tell you who is getting value.
A critical retention event forces you to be honest: it’s the one key action that clearly shows a user is doing the thing your product exists for.
Vanity metrics vs value events
Vanity metrics are numbers that are easy to track and nice to show in a slide, but they don’t prove real value:
- pageviews
- app opens
- logins
- signups without any activity
These metrics can go up even if users don’t understand your product or don’t succeed with it.
Value events are different. They are actions where the user clearly gets what you promised.
Some examples:
- SaaS app
- Vanity: login
- Value: created a project and came back to edit it three times
- Online store
- Vanity: product page view
- Value: completed an order
- Media site or streaming service
- Vanity: pageview or app open
- Value: finished an article, watched most of an episode, or listened to a full podcast
Your critical retention event should look like a value event, not a vanity one. It should describe a moment of real success for the user.
Symptoms of a bad critical event
How do you know your chosen event is wrong? Here are some red flags:
- It fires almost every time someone opens the app or site.
If almost every session triggers your “critical event”, it’s probably too generic. For example, “homepage_view” is rarely a good choice. It doesn’t tell you if the user did anything meaningful. - Only developers understand the name.
If your event is called something likeevent_123_fired, or it describes an internal technical state, most of the team won’t know what it means. A good critical event should be easy to explain to sales, marketing, and support. - You can’t explain how it connects to revenue or long-term value.
If someone asks, “How does this event relate to money or outcomes?” and the answer is unclear, you probably need a better event. You don’t need a perfect one-to-one link, but there should be a strong logical connection.
If your current “active user” event hits any of these points, don’t worry. It just means you’re ready to define a better one.
Choose Your Critical Retention Event
Let’s turn this into a simple workshop you can run with your team. You don’t need complex math—just clear thinking and a bit of data.
If you want extra context on different retention metrics and how to calculate them, this overview of retention metrics and KPIs gives a broader view of the numbers behind loyalty.
Describe what “retained customer” means in business language
First, ignore events and tracking. Sit down with your team and answer this sentence:
“After X time, a retained customer is someone who…”.
For different business types, this sentence will look different.
- SaaS subscription
“After three months, a retained customer is someone who is still paying and is actively using the main feature at least once a week.” - E-commerce store
“After six months, a retained customer is someone who has made at least two purchases.” - B2B contract
“After one year, a retained client is someone who has renewed their contract and is still using the service regularly.”
The goal is not to get a perfect sentence. The goal is to get agreement between product, marketing, sales, support, and analytics.
Once you agree on this, you can translate it into events.
Map the key value moments in your user journey
Now think about the journey from “new user” to “retained customer”. Where are the moments of value?
For a simple SaaS tool, the journey might look like this:
- Signs up
- Completes onboarding or a tutorial
- Creates the first project
- Invites a teammate
- Uses the project several times
- Upgrades to a paid plan
- Continues using the tool over time
Several of these steps are “value moments”:
- finishing the first setup
- creating something useful
- coming back to use it again
- paying for it and renewing
For an online store, a journey could be:
- Lands on site
- Browses a few products
- Adds to cart
- Completes first order
- Gets the delivery
- Comes back and buys again
Here, obvious value moments are:
- completed first order
- received item and was happy
- completed repeat order
Circle these value moments. They’re your candidate places to define a critical event.
If you’ve never formally mapped journeys before, using a customer journey mapping workshop can help you visualize touchpoints and pain points across the funnel.
List candidate events and add simple data checks
Next, translate those value moments into specific events from your tracking or database.
For example:
project_createdtask_completedorder_completedsubscription_renewedinvoice_paidlisting_publishedpayout_sent
Now, run a few simple checks (your analyst can help, but these don’t need heavy statistics):
- Coverage check
- Does this event happen for a reasonable share of your “healthy” users?
- If only 2% of your good customers ever trigger it, maybe it’s too narrow.
- Retention correlation check
- Compare users who triggered this event vs those who didn’t.
- Do the ones who triggered it come back more often or stay longer?
- Revenue check
- Is this event clearly connected to revenue or long-term value?
- For example,
order_completedorsubscription_renewedusually pass this test.
Don’t worry about making it perfect. The point is to remove obviously weak candidates and keep the strong ones.
If you want to understand how these analyses look in charts, guides on retention analysis show how to group users into cohorts and track how well each group sticks around over time.
Choose one critical event and one usage interval
You probably still have a few candidates left. That’s normal.
Now you make a choice. For each main value proposition, pick one primary critical event that will represent “this user is really using us”.
For example:
- A design tool might choose:
- Critical event:
design_exported - Interval: at least once every 14 days
- Critical event:
- A note-taking app might choose:
- Critical event:
note_edited - Interval: at least once per week
- Critical event:
- An online store might choose:
- Critical event:
order_completed - Interval: at least once per quarter
- Critical event:
The usage interval is how often a healthy user should hit the critical event to be considered “retained”. Daily for some apps, weekly or monthly for others.
This interval depends on your product’s natural rhythm:
- News app → daily or a few times a week
- Team collaboration tool → multiple times per week
- Flight booking app → a few times per year
Once you choose an event and an interval, you can build retention charts that actually match reality, instead of arbitrary “last 30 days active” counts.
Customer Retention Examples by Business Model
Let’s make this concrete with a few customer retention examples across different types of businesses. You don’t need to copy them exactly, but they should help your team think more clearly.
SaaS and subscription products
For most SaaS tools, the real value comes from using a core feature regularly, not just logging in.
Possible critical events:
- Creating or updating a project, document, or report
- Completing a key workflow (e.g., publishing a campaign, closing a ticket)
- Renewing a subscription
Example:
“Our critical event is ‘active projects updated at least once per week’. A retained customer is one who updates at least one project every week for three months.”
This pushes the team to focus on making that update flow smooth, valuable, and frequent.
E-commerce and DTC brands
For online stores, the obvious answer is “a purchase”. But you can be more specific.
Possible critical events:
- Completed second order within 90 days of the first
- Completed order above a certain value
- Purchased in a second category (cross-sell)
Example:
“Our critical retention event is ‘completed second order within 90 days’. If a customer does that, we treat them as retained.”
This definition shapes your campaigns: you focus on getting customers to that second order in the right time window, not just chasing new first-time buyers forever.
Marketplaces and platforms
Marketplaces have at least two sides: buyers and sellers. Each side has its own version of success.
Possible critical events:
- Buyer side:
order_completedorbooking_confirmed - Seller side:
payout_sentor “closed at least one sale in the last 30 days”
Example:
“For buyers, the critical event is a completed order in the last 60 days. For sellers, it’s receiving at least one payout in the last 30 days.”
This helps you see which side of the marketplace is healthy and where to invest in product or marketing improvements.
B2B and service businesses
For B2B, you often have longer cycles, contracts, and human relationships.
Possible critical events:
- Contract renewed for another period
- Implementation project successfully completed
- Quarterly business review completed and expansion agreed
Example:
“Our critical event is ‘contract renewed without downgrade’. If an account renews at the same or higher level, we count them as retained.”
Here, the usage interval is much longer—often yearly—but the logic is the same: pick the one event that clearly means “this client stayed with us”.
Don’t Forget Support: How Customer Service Shapes Retention
Retention is not just about product features and pricing. Your support and success teams play a big role, especially in B2B and complex products. In many companies, retention customer service is a major part of why customers stay.
When things go wrong—and they always do—support can turn a frustrated user into a loyal advocate or push them out the door.
When support actions become part of your critical event
In some businesses, support events are so important that they become part of the retention story.
Examples:
- A customer has a serious issue, opens a ticket, and your team resolves it quickly and clearly. As a result, they expand their usage or renew their contract.
- A new customer goes through a structured onboarding session with a customer success manager. After that, their usage and satisfaction jump.
In these cases, support actions might not be the main critical event, but they strongly influence whether the critical event happens again.
Events you can track for retention customer service
You can add support-related events to your tracking plan to see how they affect retention. For example:
ticket_resolved_within_sla– the issue was solved within your promised time.onboarding_session_completed– a live or recorded onboarding session finished.nps_submittedwith a high score – the customer gave strong positive feedback.success_review_completed– a quarterly or annual business review meeting held.upsell_accepted– customer agreed to upgrade after a consultation.
Tools and templates for feedback collection, such as NPS survey templates, can help you structure how you gather and track satisfaction scores over time.
For B2B teams, the question what is client retention often leads to answers that include service quality, renewals, and long-term relationship health, not just raw usage numbers.
You don’t have to make these support events your primary critical event, but tracking them next to it can show you where customers are saved—or lost.
Put Your Critical Event into Tracking Plans and Dashboards
Choosing a critical event is great, but it won’t help much if it only lives in a slide deck. You need to bake it into your tracking plan and dashboards so the whole team can see and use it.
Updating your tracking plan without breaking everything
Here are a few safe practices when updating your events:
- Avoid silently renaming existing events.
Renamingevent_Atoevent_Bwithout tracking history can break old reports. Instead, consider adding a new, clearer event and keeping the old one until you migrate. - Use human-readable names.
Names likeorder_completed,contract_renewed, orproject_updatedare easier to understand thanev_001. Everyone should be able to guess what the event means. - Write down when the event fires.
Document the exact trigger: which screen, which button, which API call. This avoids confusion like “Does this fire on test orders?” or “Does it fire when we cancel?” - Document event properties.
Note what extra data comes with the event: order value, plan type, device, region, etc. These will be useful when you segment retention later. - Share the changes.
Make sure product, marketing, and support know which event is now your critical retention event and where they can see it in reports.
Building a simple retention view around your critical event
You don’t need a huge BI project to get started. A few focused views around your critical event can go a long way.
Useful pieces:
- Cohort retention chart
- Group users by the week or month they first triggered the critical event.For each cohort, show what percentage hit the event again in later periods.This shows whether newer cohorts retain better or worse than older ones.
- Usage frequency distribution
- For your active customers, show how often they trigger the critical event within the usage interval.
- For example: “once a month”, “2–3 times a month”, “once a week”, “multiple times a week”.
- Power users vs one-and-done
- Define a “power user” segment: people who trigger the event much more often than average.
- Define a “one-and-done” segment: people who triggered it only once and disappeared.
- Compare their behavior, channels, and support interactions.
For revenue-focused teams, it’s also useful to look at net revenue retention alongside customer-based retention, so you see not only how many customers stay but how their spend changes over time.
These simple views give your weekly product or marketing meetings something solid to look at. Instead of “our retention feels bad”, you can say “our month-two retention after the first critical event dropped by 5 percentage points for the last three cohorts—let’s investigate why”.
Summary and Next Steps
Let’s recap the path from vague metrics to a clear critical retention event.
- Understand retention in business language.
Agree on what “a retained customer” means after a certain time, without talking about events yet. - Map value moments in the user journey.
Find the steps where customers actually get value: finishing setup, placing an order, renewing, getting a problem solved. - List candidate events and run simple checks.
Turn value moments into concrete events and check which ones cover healthy users, correlate with coming back, and connect to revenue. - Pick one critical event and a usage interval.
For each main value proposition, choose one event that represents success, and decide how often it should happen for someone to be “retained”. - Bake it into tracking and dashboards.
Update your tracking plan, make the event readable and well-documented, and build a few simple views around it.
Here’s a quick checklist you can use this week:
- Write one sentence that defines a retained customer for your business.
- Map 4–7 key value moments in your user journey.
- List 3–5 events that could be your critical retention event.
- Run basic data checks to see which event best correlates with long-term use or revenue.
- Choose your first version of a critical event and usage interval.
- Add or update this event in your tracking plan and create at least one cohort chart around it.
Don’t stress about finding the “perfect” critical event on day one. Start with a clear, reasonable choice, test it, and refine as you learn. Even a “good enough” critical event is far more useful than a dashboard full of vague “active user” numbers.
Most importantly, get your team in a room, walk through this process, and leave with one simple, powerful decision:
“This is the action that turns a user into a loyal customer for us.”