Your web server already knows who visited your site, when they arrived, which pages they read, and where they came from. It writes all of that into a text file, one line per request, every single second. Most site owners completely ignore those files. That is a mistake — and an opportunity.
Log file analytics means reading your server’s access logs directly instead of running JavaScript on your visitors’ browsers. Tools like GoAccess make this surprisingly practical. No tracking snippet, no cookies, no consent banner — just your server doing what it already does, and you finally reading the output.
This guide walks you through how log-based analytics works in practice, how to set up GoAccess on a Linux server, and where the approach genuinely falls short. I’ll be honest about the limits, because there are real ones.
Why Log File Analytics Deserves a Second Look
The usual privacy-first analytics workflow installs a JavaScript snippet on every page. The snippet loads, fires a request to your analytics server, and records a visit. It works, and tools like Plausible, Umami, and Matomo covered in our self-hosted analytics guide do this well. But the snippet is still client-side code running in your visitor’s browser.
Log-based analytics flips this around entirely. Your web server — nginx, Apache, Caddy — already logs every incoming HTTP request before a browser even finishes loading your page. No JavaScript involved. No client-side dependency. No chance for an ad-blocker to suppress it.
That has some concrete advantages:
- Zero JavaScript on visitors’ devices. Nothing to block, nothing to slow down page load.
- Inherently server-side. You analyse logs you already control, on infrastructure you already own.
- Works on any static site. Even a plain HTML file served from nginx produces access logs you can analyse.
- Captures everything the server sees — including resource requests, 404s, redirect chains, and crawler traffic.
For context on how this fits alongside cookie-free approaches generally, read our piece on how cookie-free analytics works and why it matters.
What GoAccess Actually Does
GoAccess is an open-source, real-time log analyser released under the MIT license (it moved from the GPL to MIT back in 2016). It reads your existing web server access log — in whatever format nginx, Apache, or Caddy wrote it — and produces either a rich terminal dashboard or a self-contained static HTML report. You can find it and its documentation at goaccess.io.
The terminal view is a live, ncurses-style dashboard. You pipe a log file to GoAccess and get sorted panels: unique visitors, most-requested URLs, response codes, referrers, browsers, operating systems. It refreshes in real time if you tail a live log. The HTML export is a single file with embedded JavaScript for client-side interactivity — but that JavaScript only runs in your own browser when you open the report, never on your visitors’ devices.
There is no separate application to install, no database to configure, no background service to keep running. GoAccess reads a file and produces output. That simplicity is its greatest strength.
Setting Up GoAccess: A Real Walkthrough
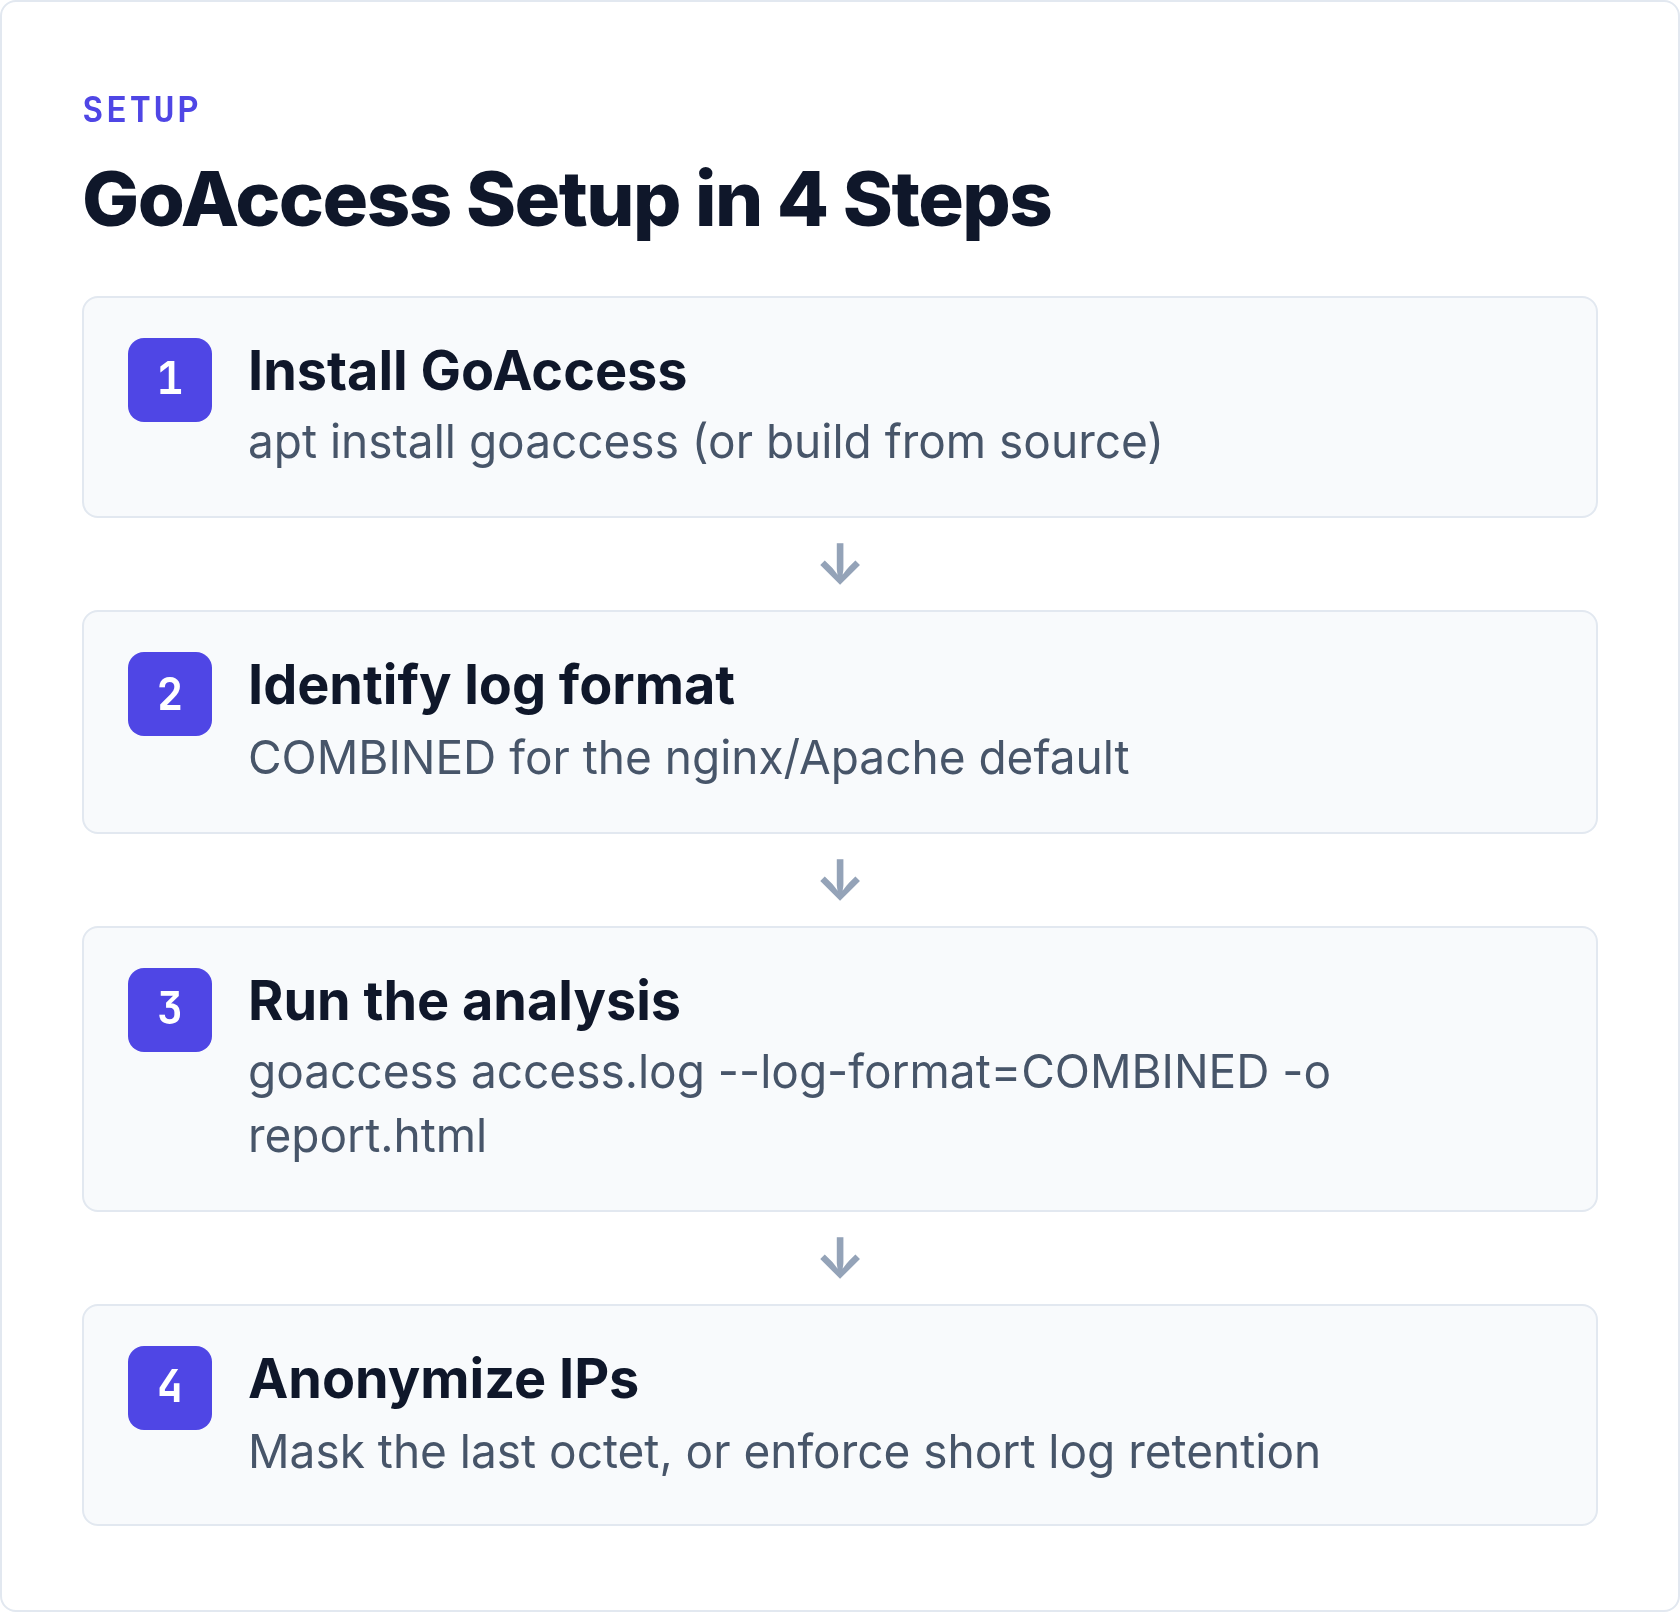
Step 1 — Install GoAccess
On Debian/Ubuntu:
apt install goaccessOn RHEL/AlmaLinux/Rocky, enable EPEL first:
dnf install epel-release
dnf install goaccess
Alternatively, the GoAccess download page has packages and build instructions for most distributions. The version in package managers is sometimes a release or two behind the upstream binary.
Step 2 — Understand Your Log Format
GoAccess needs to know how your server formats its log lines. The default nginx combined log format looks like this:
192.168.1.10 - - [12/Jun/2026:14:23:01 +0200] "GET /about/ HTTP/2.0" 200 4218 "https://example.com/" "Mozilla/5.0 ..."GoAccess has built-in presets for the most common formats. The most useful ones:
| Format name | GoAccess flag | Use for |
|---|---|---|
| Combined (nginx default) | --log-format=COMBINED |
nginx, Apache combined log |
| Common Log Format | --log-format=COMMON |
Apache common log |
| Caddy (JSON) | --log-format=CADDY |
Caddy structured logs |
| W3C Extended | --log-format=W3C |
IIS logs |
| Custom | --log-format="..." |
Any non-standard format |
If you use the default nginx log format, the COMBINED preset works directly. The nginx log module documentation describes the exact field order if you need to write a custom format string. Apache’s mod_log_config documentation covers the same for Apache deployments.
Step 3 — Run a Basic Analysis
The simplest invocation reads your access log and opens the terminal dashboard:
goaccess /var/log/nginx/access.log --log-format=COMBINEDTo generate a static HTML report instead of the terminal view:
goaccess /var/log/nginx/access.log \
  --log-format=COMBINED \
  --output=/var/www/html/report.html
To analyse multiple rotated log files at once — which is what you almost always want for historical data:
zcat /var/log/nginx/access.log.*.gz | \
  goaccess /var/log/nginx/access.log - \
  --log-format=COMBINED \
  --output=/tmp/full-report.html
That last command combines the live log with all compressed rotated files. In my experience, this is the command you will use most often when reviewing a full month of traffic.
Step 4 — Use a Configuration File
Typing flags every time gets tedious. GoAccess accepts a configuration file at /etc/goaccess/goaccess.conf or ~/.goaccessrc. A minimal working config for nginx:
log-format COMBINED
log-file /var/log/nginx/access.log
output /tmp/report.html
exclude-ip 127.0.0.1
With that in place, a bare goaccess command uses all defaults from the file.
IP Anonymization: The GDPR Detail You Cannot Skip
Raw server logs contain full IP addresses. Under the GDPR, an IP address is personal data — it can (in principle) identify a natural person. Storing full IPs in your log files without a legal basis creates compliance exposure, even if you never intentionally look at them.
There are two practical approaches.
Anonymize at the nginx level before the log is written. Add a GeoIP map or a simple masking block in your nginx config that zeroes the last octet of IPv4 and the last 80 bits of IPv6:
geo $remote_addr $anonymized_addr {
    default $remote_addr;
}

map $remote_addr $anonymized_ip {
    ~(?P<ip>\d+\.\d+\.\d+)\.\d+     $ip.0;
    ~(?P<ip>[^:]+:[^:]+:[^:]+:[^:]+:[^:]+:[^:]+:[^:]+):[^:]+ $ip:0;
    default                          $remote_addr;
}

log_format privacy '$anonymized_ip - $remote_user [$time_local] ...';
Alternatively, configure log retention policies. The EDPB guidance on personal data supports a short retention window (typically 7–14 days) for infrastructure logs as a legitimate interest, provided you document the purpose and minimise data. Deleting logs automatically via logrotate after 7 days is the simplest compliant approach for small sites.
GoAccess itself does not store anything — it only reads. But the raw log files it reads from may need attention before you can claim cookie-free, privacy-safe analytics.
What Log File Analytics Cannot Do
I want to be direct here, because this is where log-based analytics genuinely falls short and you should know before committing to it as your only solution.
Bot Noise Is Real
Your access logs include every request your server handled — real visitors, search crawlers, vulnerability scanners, uptime monitoring pings, and feed readers. GoAccess filters known bots by user-agent string, but that filter is imperfect. A sophisticated crawler with a spoofed user-agent looks exactly like a real visitor in your logs.
In practice, on a site with reasonable traffic, bot noise inflates raw request counts by anywhere from 20% to 60% depending on your niche. Technical and developer-focused sites attract more crawler traffic. The GoAccess dashboard has a “Crawlers” panel that separates identified bots, but unidentified ones end up mixed into your visitor counts. Our article on bot traffic detection in privacy-first analytics covers filtering strategies in more detail.
Client-Side Events Are Invisible
If a user clicks a button, fills a form, or navigates between sections of a single-page application without triggering a new HTTP request, your logs see nothing. Log analytics is fundamentally page-load analytics. You get URL hits, not interactions.
This means you cannot track:
- SPA route changes that do not produce a full page request
- Form submissions handled entirely by JavaScript
- Scroll depth, click heatmaps, or engagement time
- Custom conversion events
For these requirements, you need a JavaScript-based analytics tool — even a privacy-first one. Log analytics works best as a complement to a client-side tool, not as its replacement for complex applications.
Sessions Are Approximated
Log files do not inherently know that two requests from the same IP address 30 seconds apart were the same person. GoAccess groups requests into “unique visitors” using IP address plus user-agent string — a reasonable approximation, but not accurate for users behind shared NAT (offices, mobile carriers) or for the same person visiting from multiple devices.
Where Log Analytics Genuinely Shines
Despite those caveats, there are situations where log file analytics is exactly the right tool.
Static sites and documentation. If you run a Hugo, Jekyll, or Gatsby site with no JavaScript framework, logs give you complete traffic data without any tracking layer.
Debugging and infrastructure work. 404 rates, response time distribution, asset request frequency — these are in your logs and GoAccess surfaces them clearly. This is operational data your JavaScript analytics tool typically does not collect.
Audit trails and SEO verification. You can confirm that Googlebot crawled a newly published URL within an expected timeframe by grepping your access log. No third-party tool needed.
Air-gapped or high-security environments. If outbound connections from your server are restricted, a log analyser that reads local files is the only analytics option that works at all.
Privacy-maximalist use cases. For sites where even a self-hosted analytics ping is considered too much, log analysis satisfies the requirement with zero additional footprint.
Common Mistakes to Avoid
A few things that catch people out when they first set up log-based analytics:
Not excluding your own IP. If you visit your own site regularly during development, your requests inflate the numbers. Add --exclude-ip YOUR_IP to your GoAccess invocation, or filter in your nginx config before the log is written.
Analysing only the current log file. Nginx and Apache rotate logs nightly by default, compressing older files to access.log.1.gz, access.log.2.gz, and so on. If you run GoAccess only against access.log, you see only today’s traffic. Combine rotated archives for meaningful historical analysis.
Not setting a time zone. GoAccess defaults to UTC unless you specify --tz=Europe/Warsaw (or your server’s local timezone). Mismatched timezones make hourly traffic patterns hard to read.
Treating raw visitor counts as gospel. Always check the Crawlers panel in GoAccess and sanity-check against a second data source if you’re making decisions based on traffic volume.
Leaving full IPs in logs longer than necessary. Set up logrotate to delete or compress logs after 7–14 days, or anonymize at the nginx level from the start. Do not accumulate years of raw IP data by default.
GoAccess vs. Client-Side Privacy Analytics: When to Use Which
| Requirement | Log analytics (GoAccess) | JS-based privacy analytics |
|---|---|---|
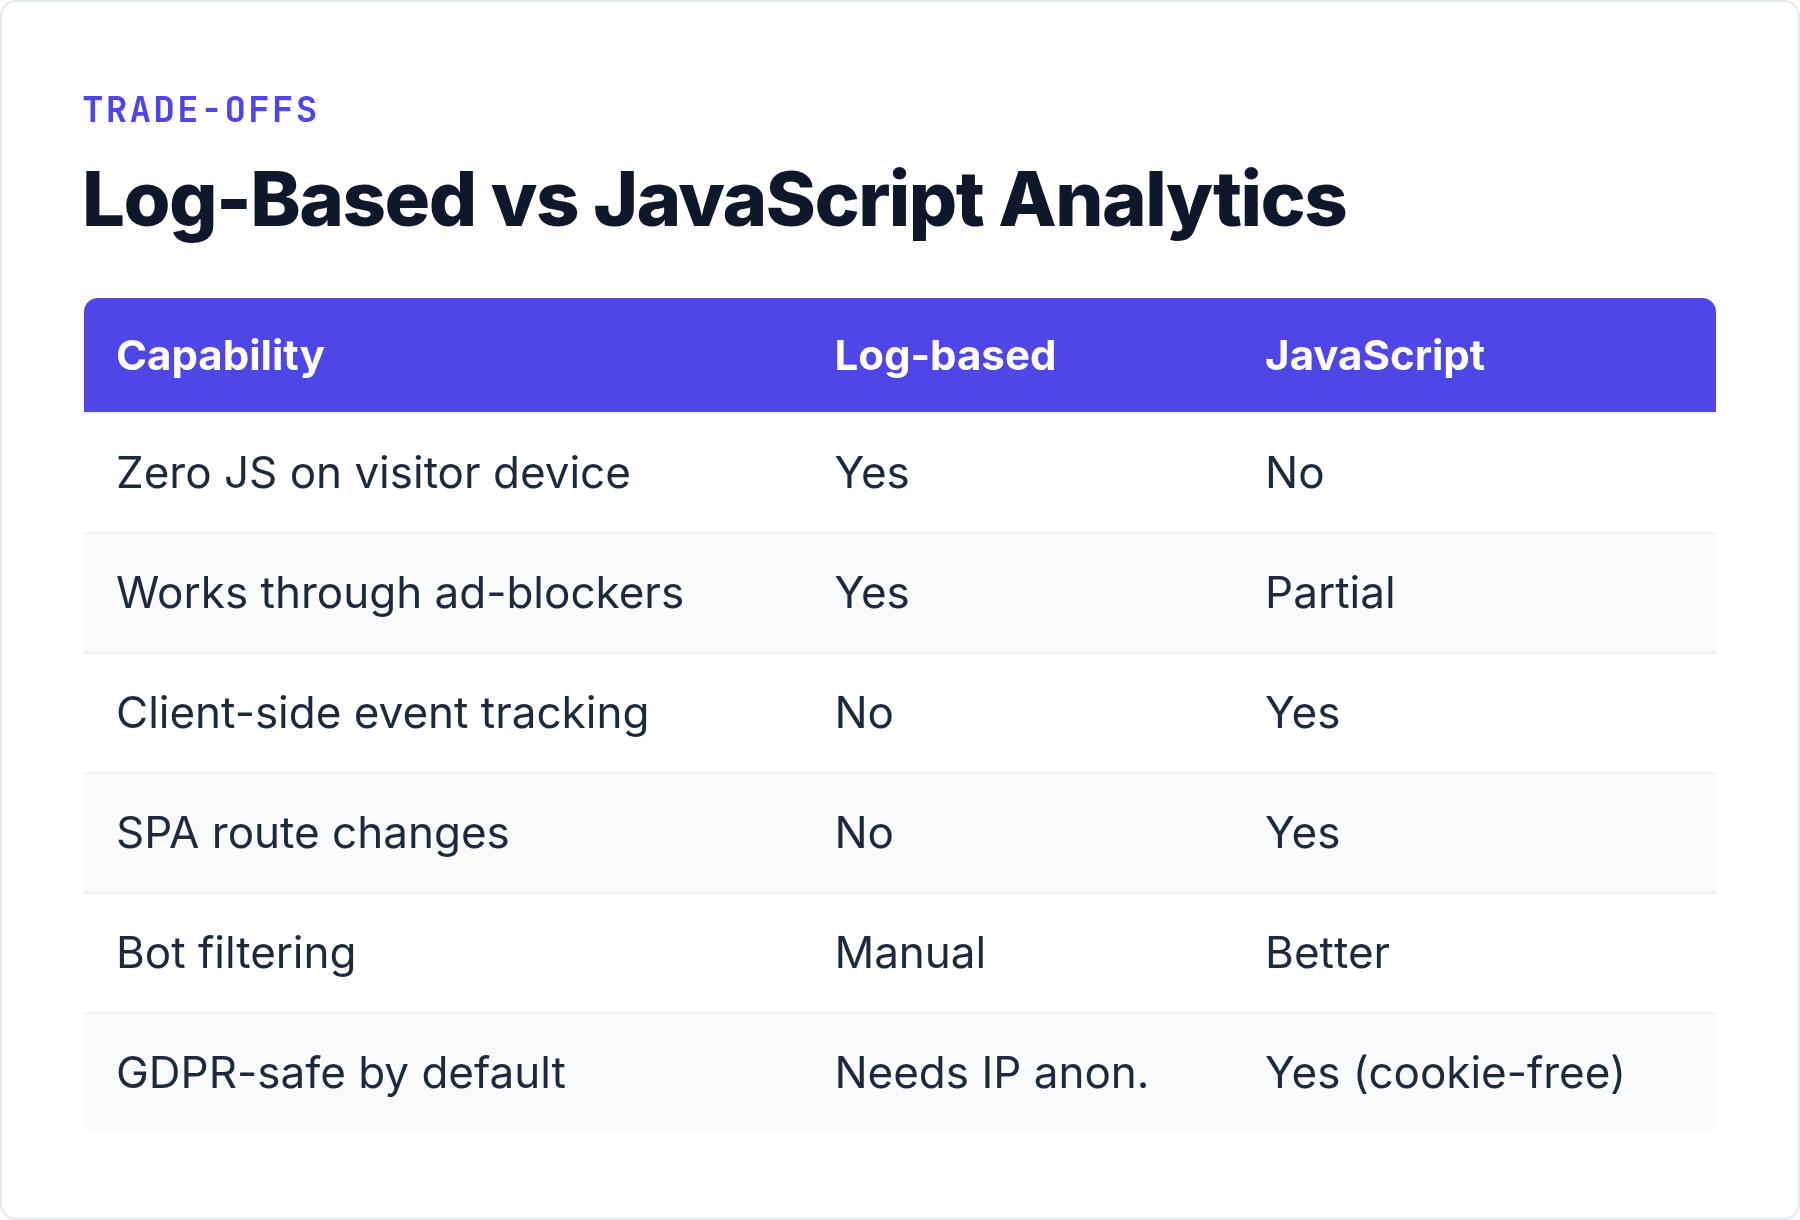
| Zero JS on visitor’s device | Yes | No (tiny snippet required) |
| Works with ad-blockers | Yes (server-side) | Partially (self-hosted helps) |
| Client-side events | No | Yes |
| SPA route tracking | No | Yes |
| Bot filtering | Partial (user-agent) | Better (JS doesn’t run in most bots) |
| Real-time dashboard | Terminal or HTML report | Web UI |
| Setup complexity | Low (one binary) | Medium (app + DB + DNS) |
| GDPR: raw IPs | Needs anonymization | Handled by tool |
The honest answer is that these approaches complement each other rather than compete. I run GoAccess for infrastructure-level checks — 404 rates, crawler verification, traffic spikes that might indicate a server issue — and a client-side tool for conversion-oriented metrics where accuracy about real users matters.
Bottom Line
Log file analytics with GoAccess is not a replacement for a purpose-built analytics tool, but it deserves a place in your stack. The setup takes under ten minutes. It produces zero client-side footprint by definition. The data is yours, stored on your server, readable with a command you can understand entirely.
The two things to address seriously: bot noise (use the Crawlers panel, sanity-check counts) and IP addresses in raw logs (anonymize at write time or enforce short retention). Do those two things, and log-based analytics is about as privacy-respecting as web measurement gets.
If you want the client-side complement — accurate session tracking, event capture, conversion funnels — our self-hosted analytics complete guide covers the main options with honest comparisons of setup complexity and data ownership trade-offs.